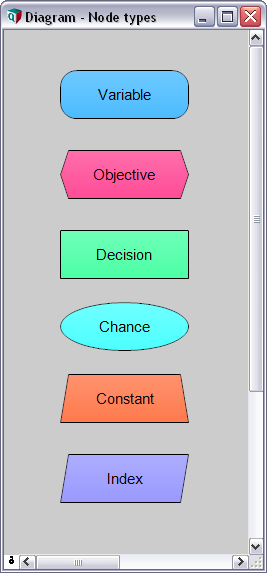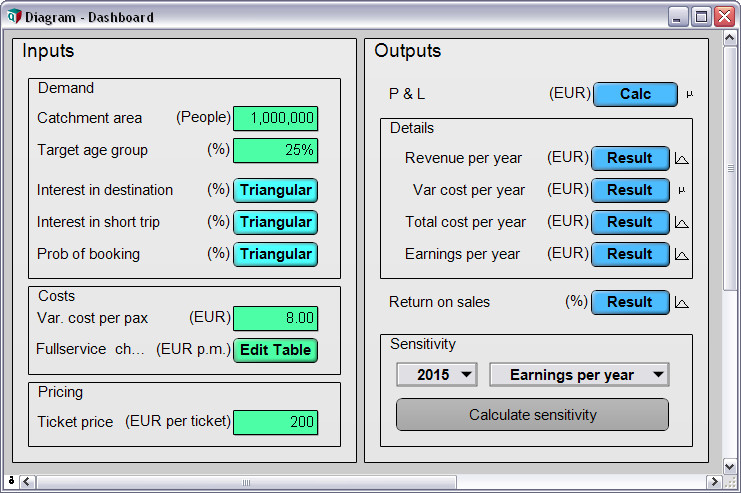
Intuitive Visual Modeling
Intuitive influence diagrams let you create a model the way you think, and communicate clearly with colleagues and clients.
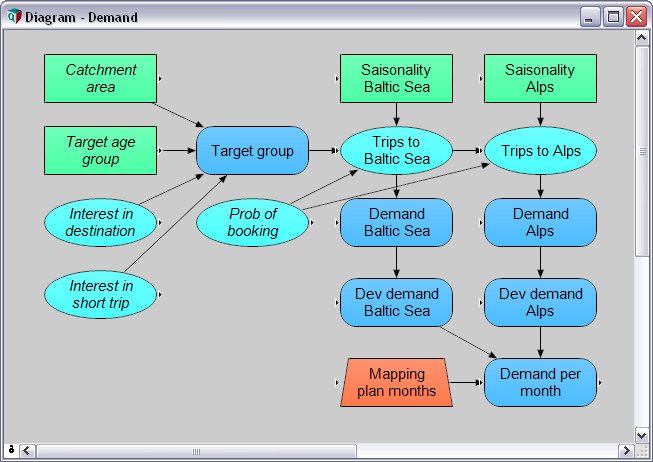
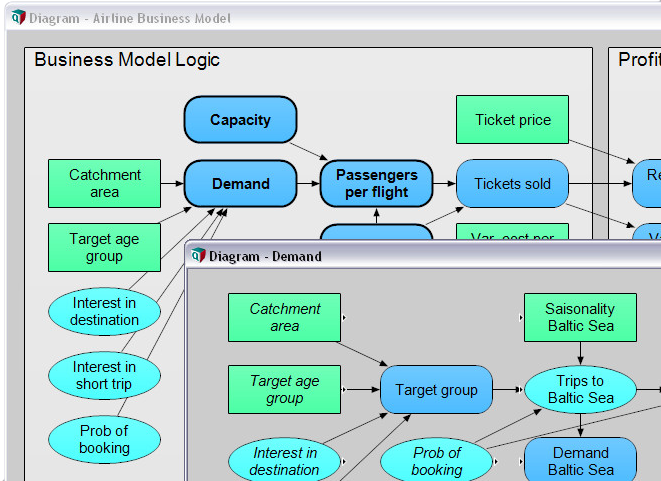
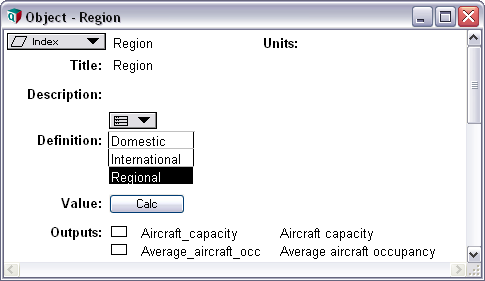
An Analytica model is organized as a hierarchy of influence diagrams. They show you the big picture and let you build and navigate your model visually. Think of this as an interactive whiteboard—but with all the details, calculations, and numbers underneath.
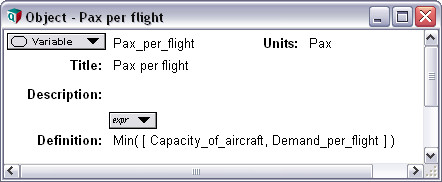
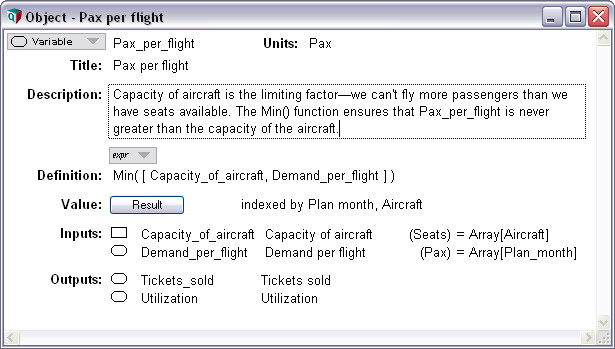
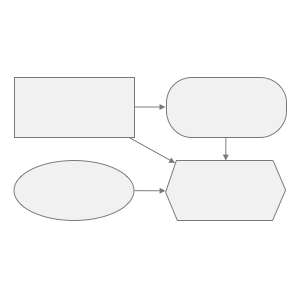
Multidimensional Calculation
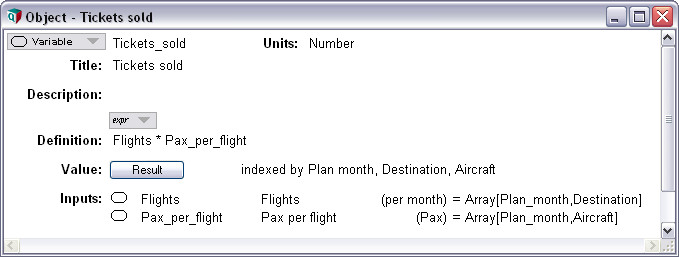
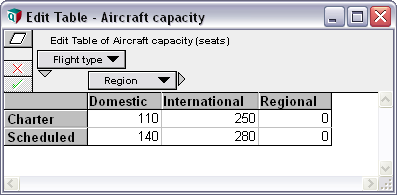
Intelligent Arrays™ let you create and manage tables with many dimensions with an ease and reliability not possible in Excel.
Although the influence diagram appears as simple, it scales up to handle complex, multidimensional problems—effortlessly. Don’t worry about the rows-and-columns layout of your model. You create, change, or extent dimension, and Analytica cares about the rest.
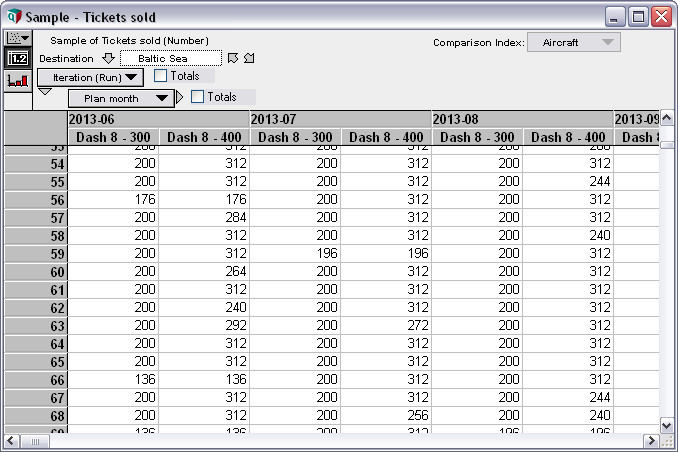
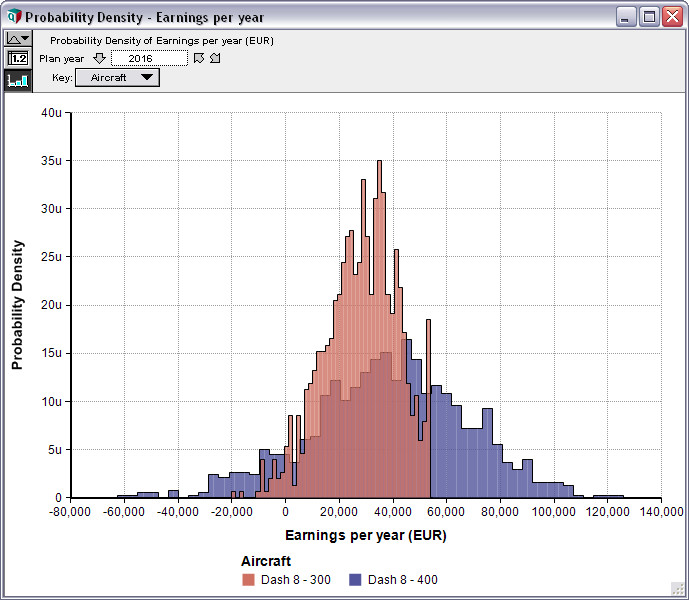
Monte Carlo Simulation
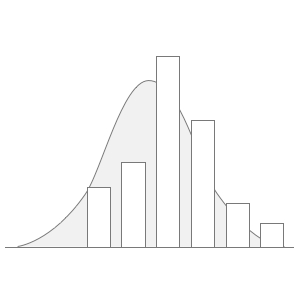
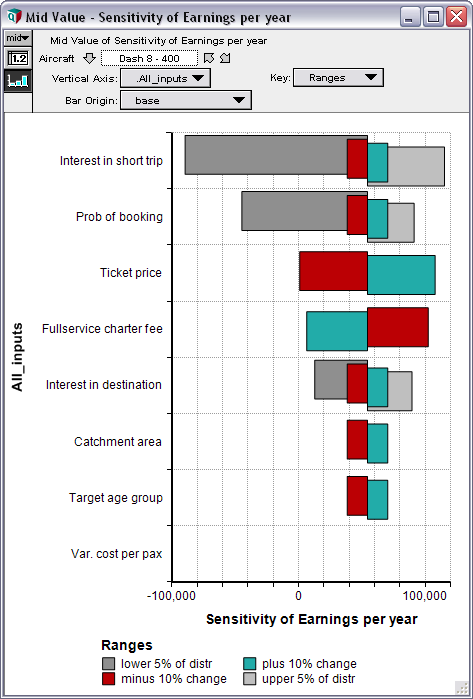
Efficient Monte Carlo simulation lets you quickly evaluate risk and uncertainty, and find out what variables really matter and why.
You can easily replace any variable in your model with a probability distribution. Analytica generates sample values based on this and let you see and analyze the effects on every “downstream” variable in the model. With no special statistical expertise required.