


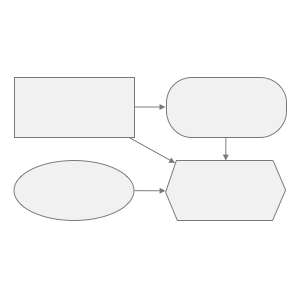
An Analytica model is organized as a hierarchy of influence diagrams. They show you the big picture and let you build and navigate your model visually. Think of this as an interactive whiteboard—but with all the details, calculations, and numbers underneath.
Drill down, up or sideways. Analytica’s influence diagrams are your model’s visual roadmap. With a hierarchy of nested modules, you always know where you are and can quickly move to any desired level or module.
Build, navigate, present and explain your model’s structure with speed and confidence. Never again hunt down and decipher arcane row-and-column coordinates or formulas. Dispense with building separate summary models and reports in order to present and support your results. Your Analytica model is all you need.
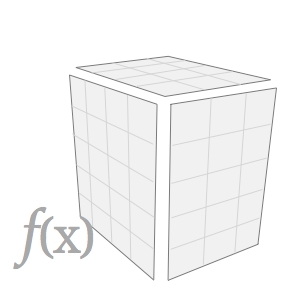

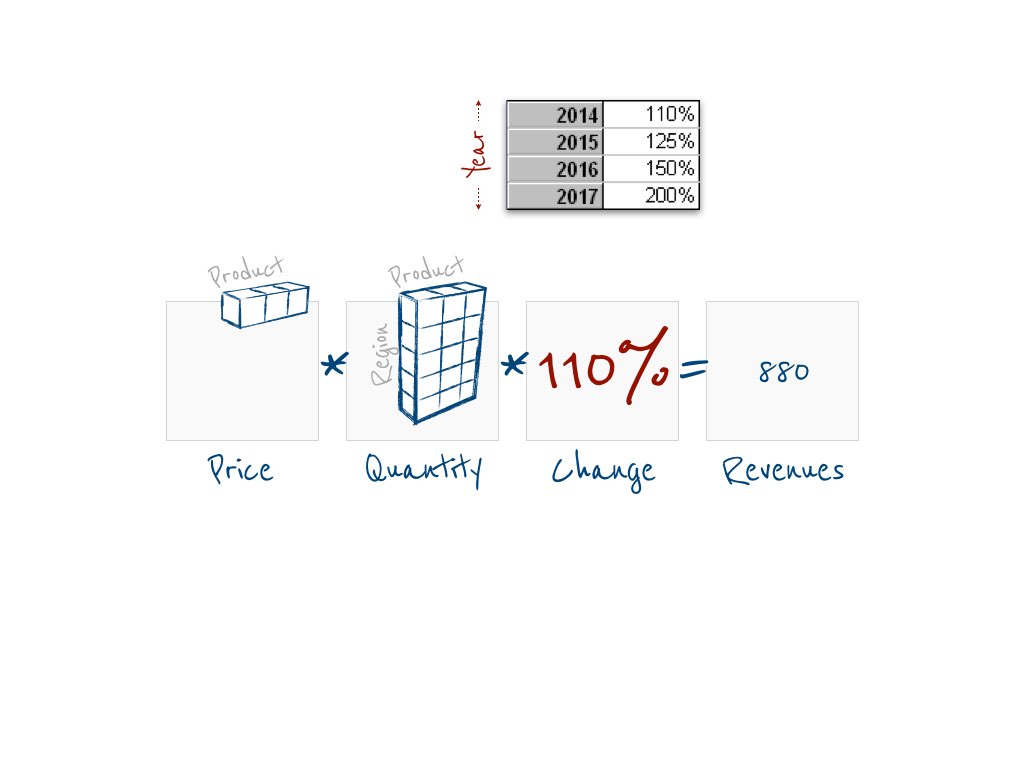
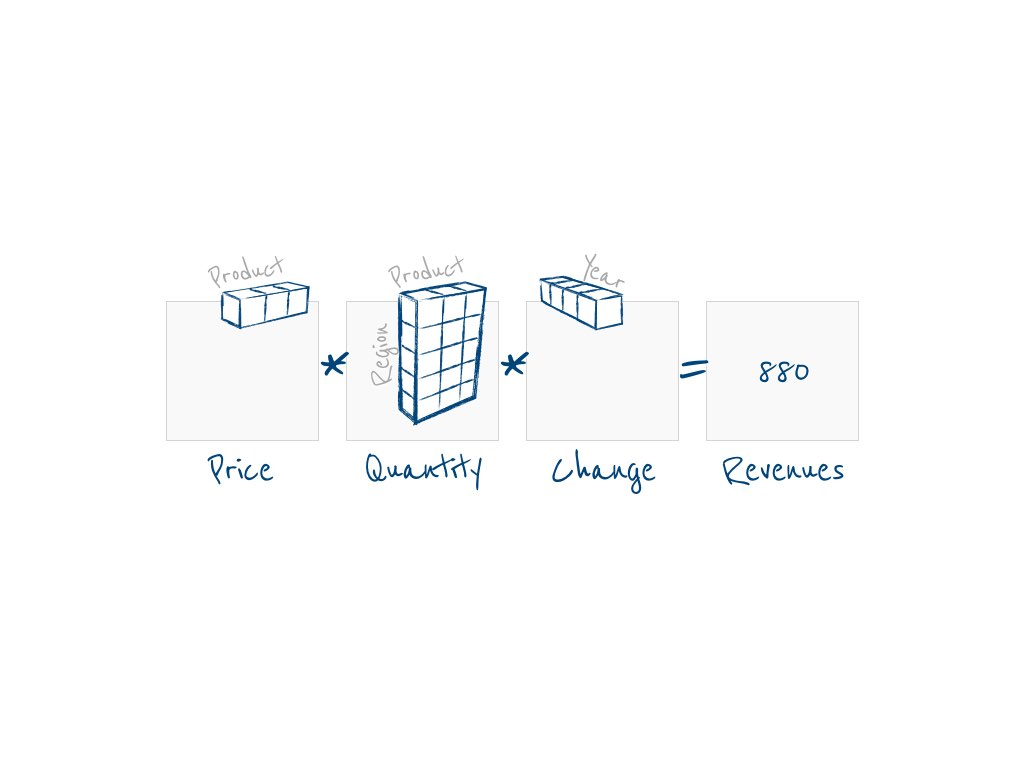
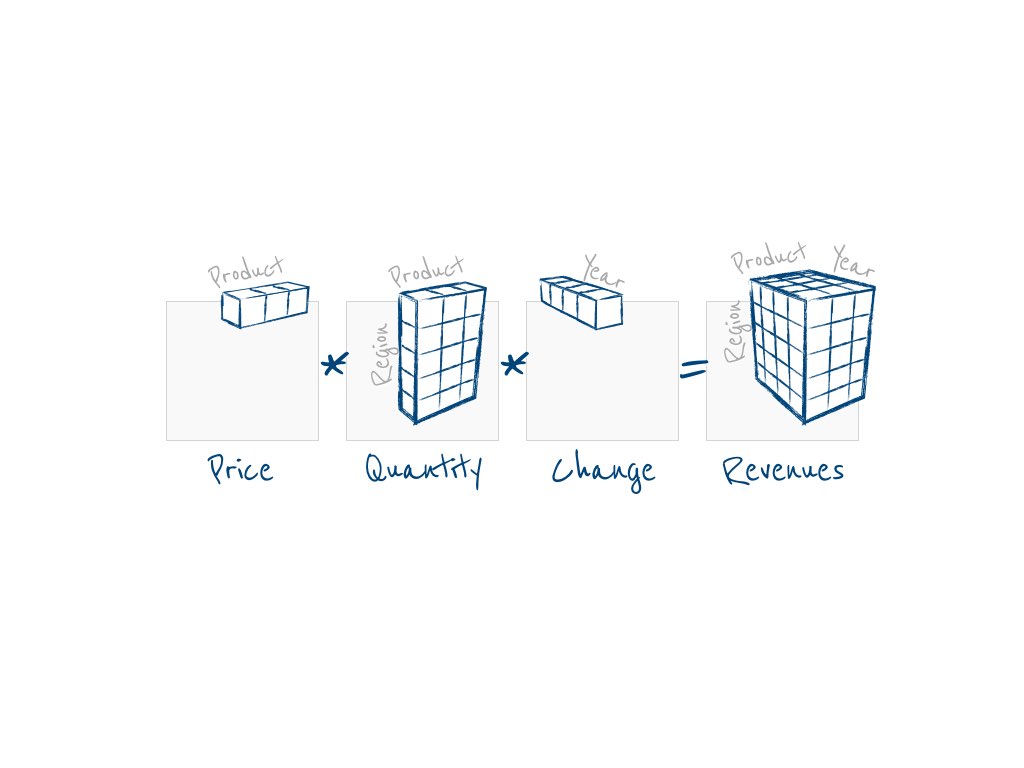
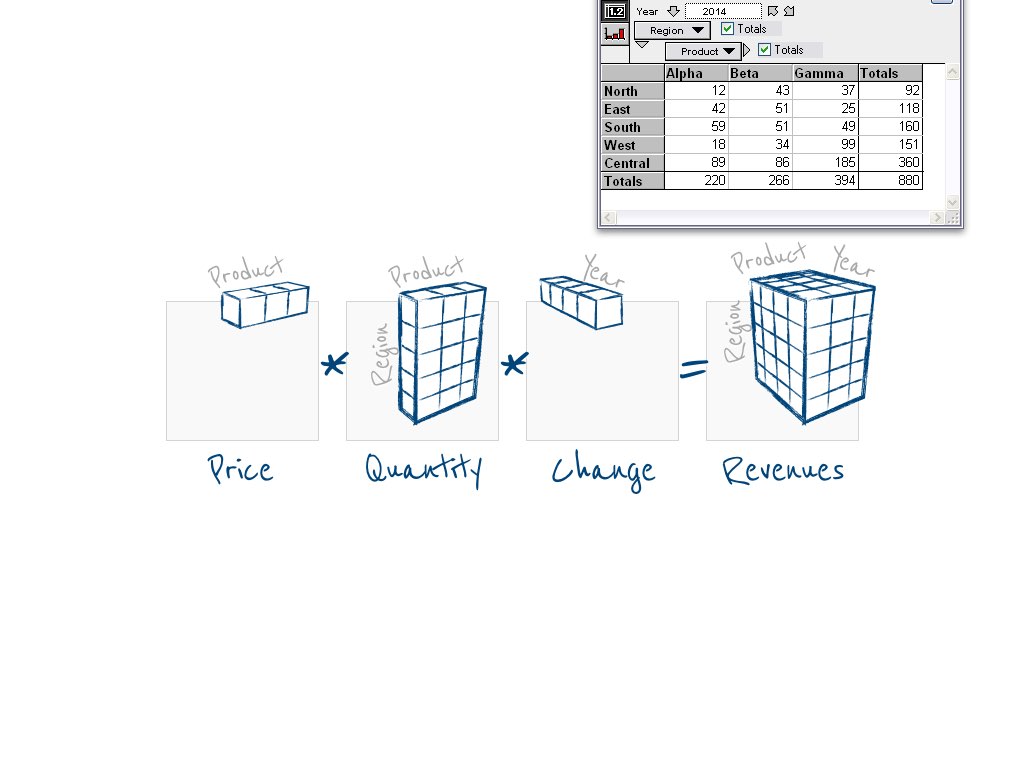
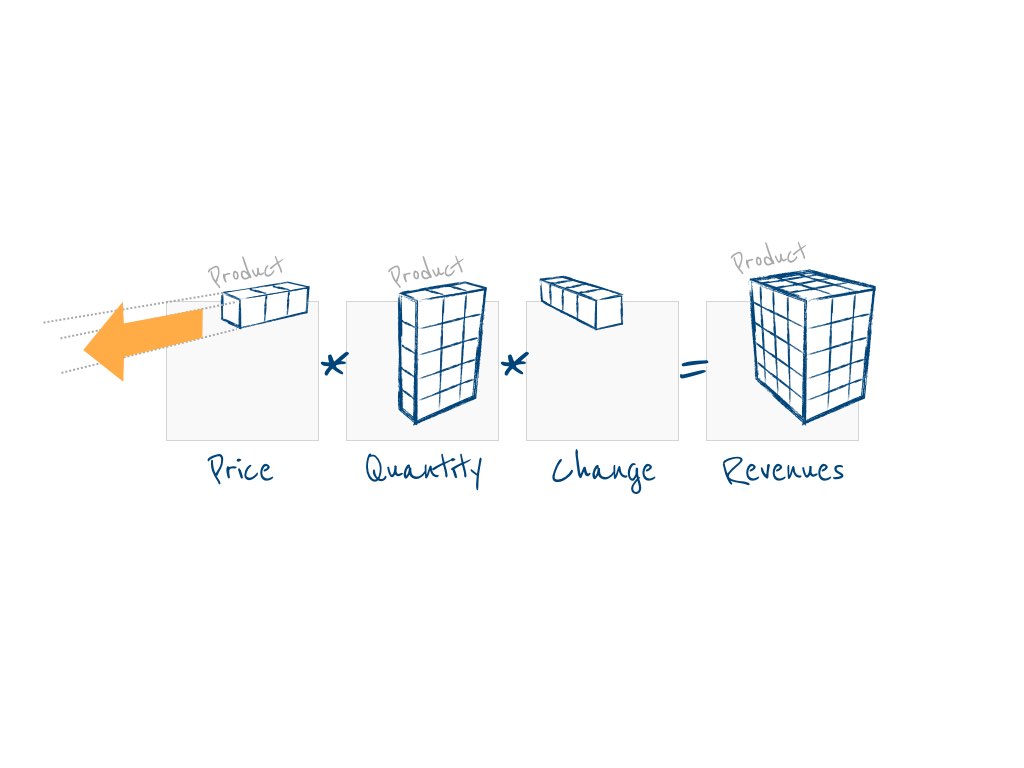
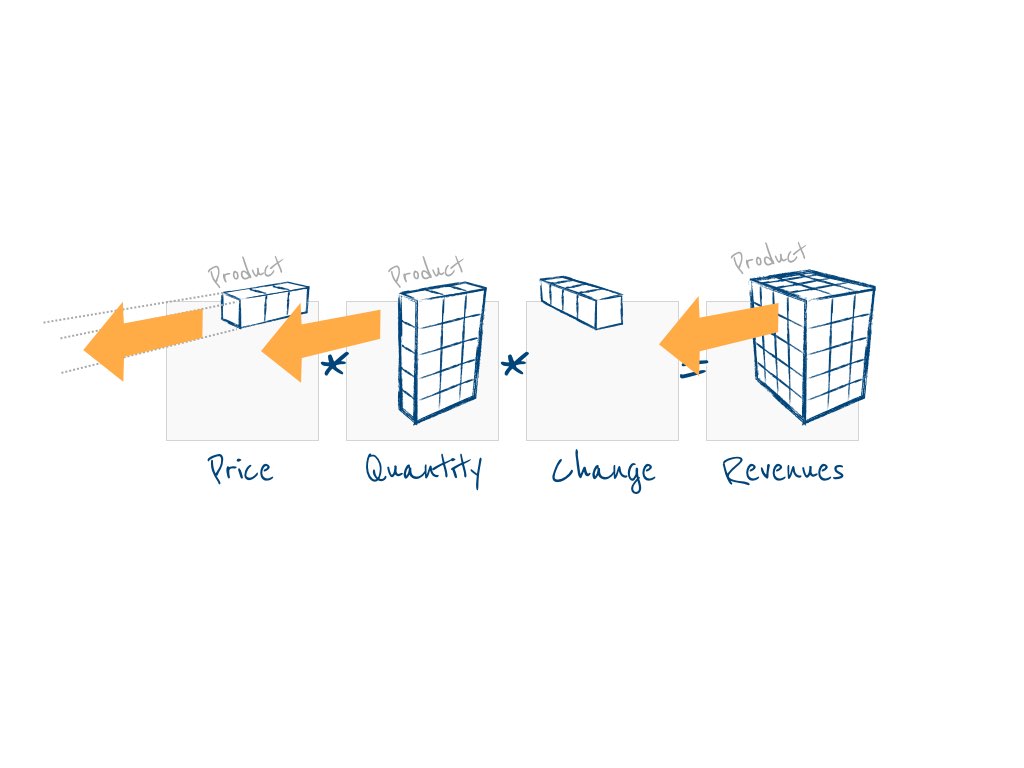
Although the influence diagram appears as simple, it scales up to handle complex, multidimensional problems—effortlessly. Don’t worry about the rows-and-columns layout of your model. You create, change, or extent dimension, and Analytica cares about the rest.
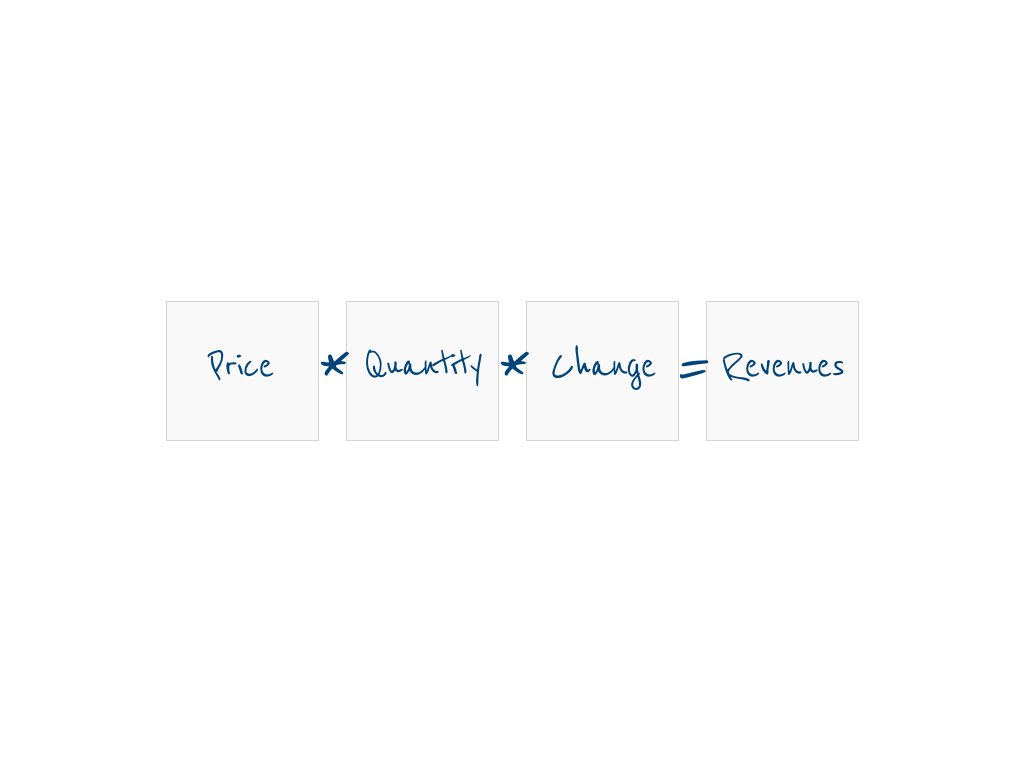
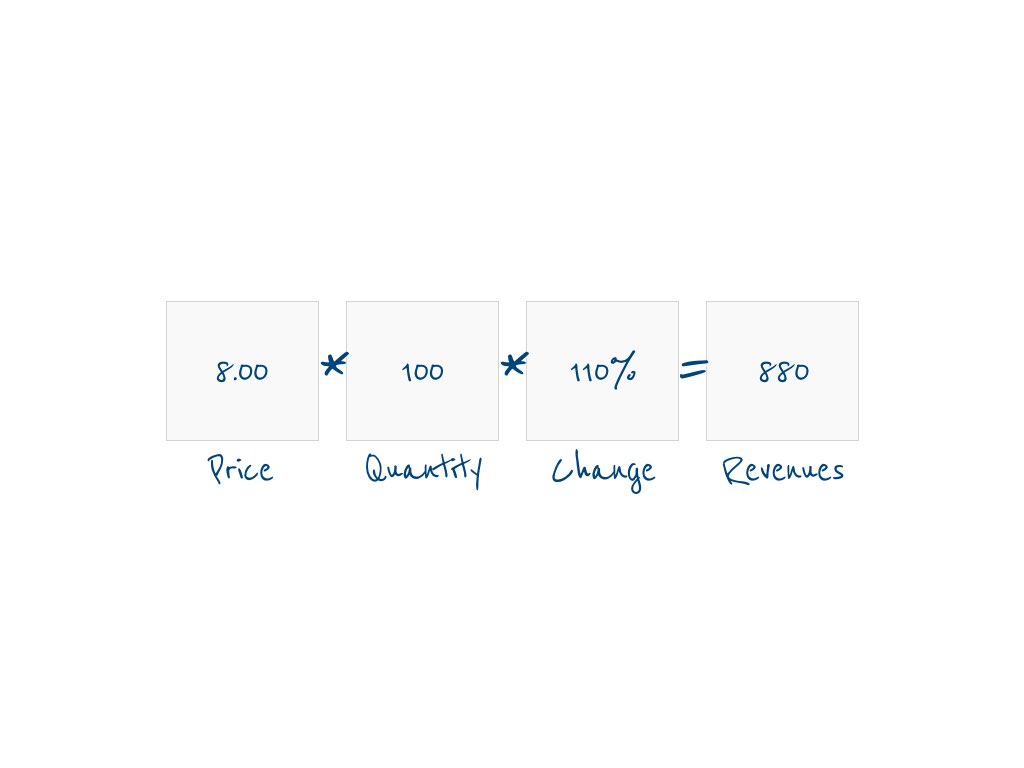
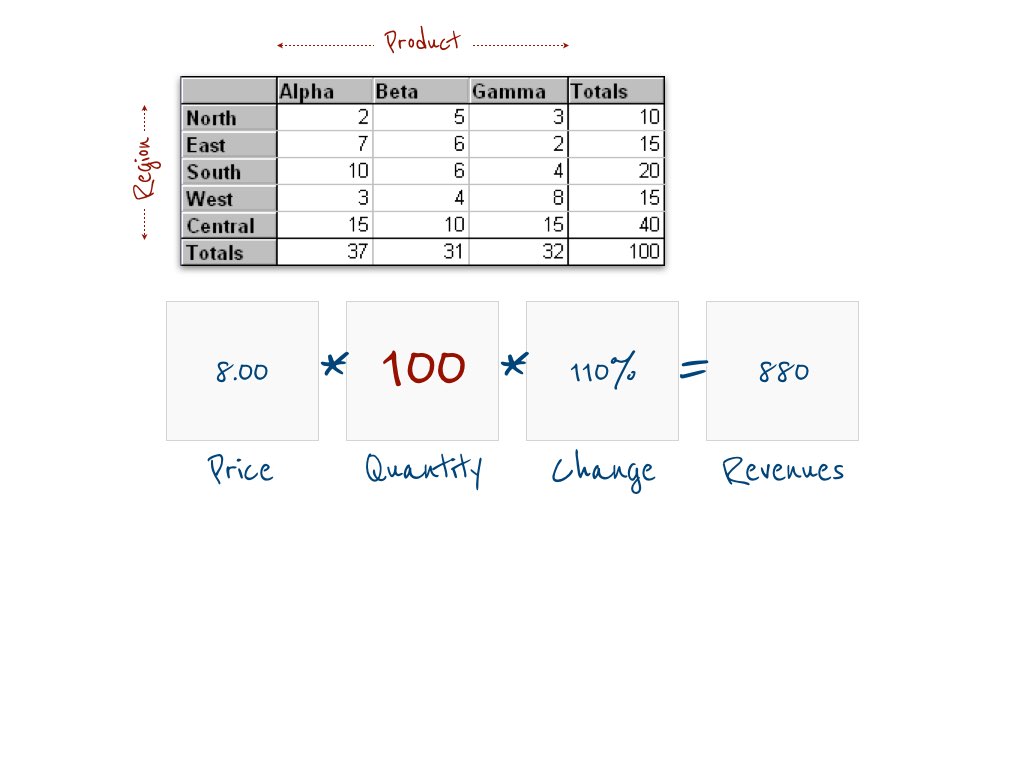
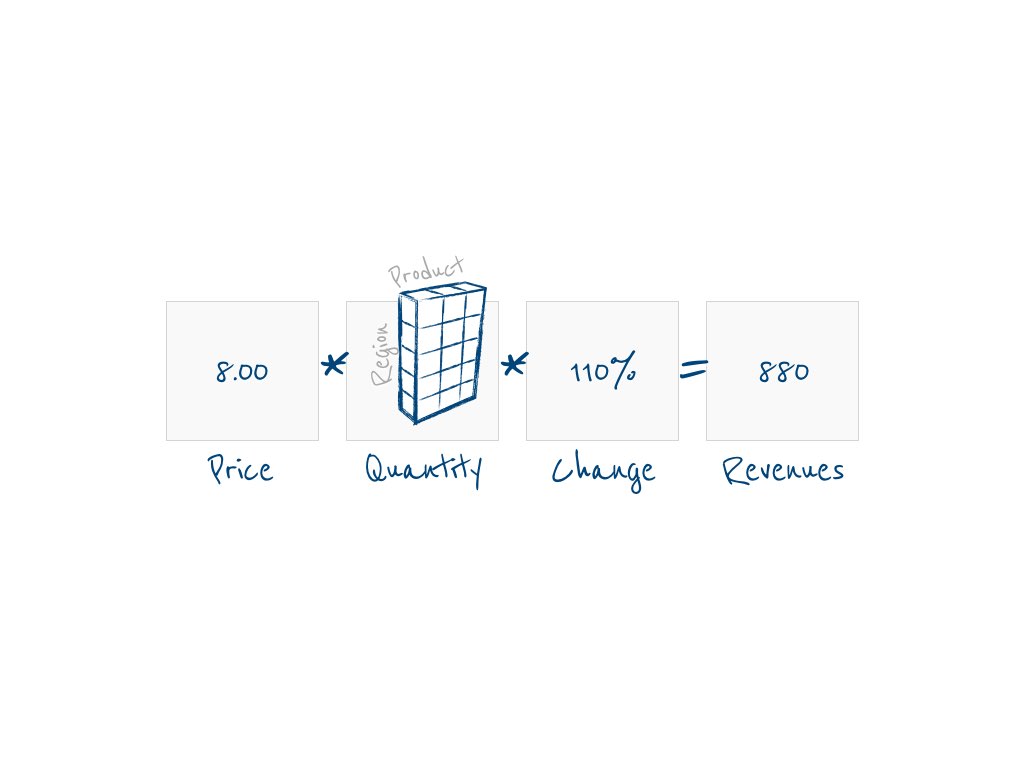
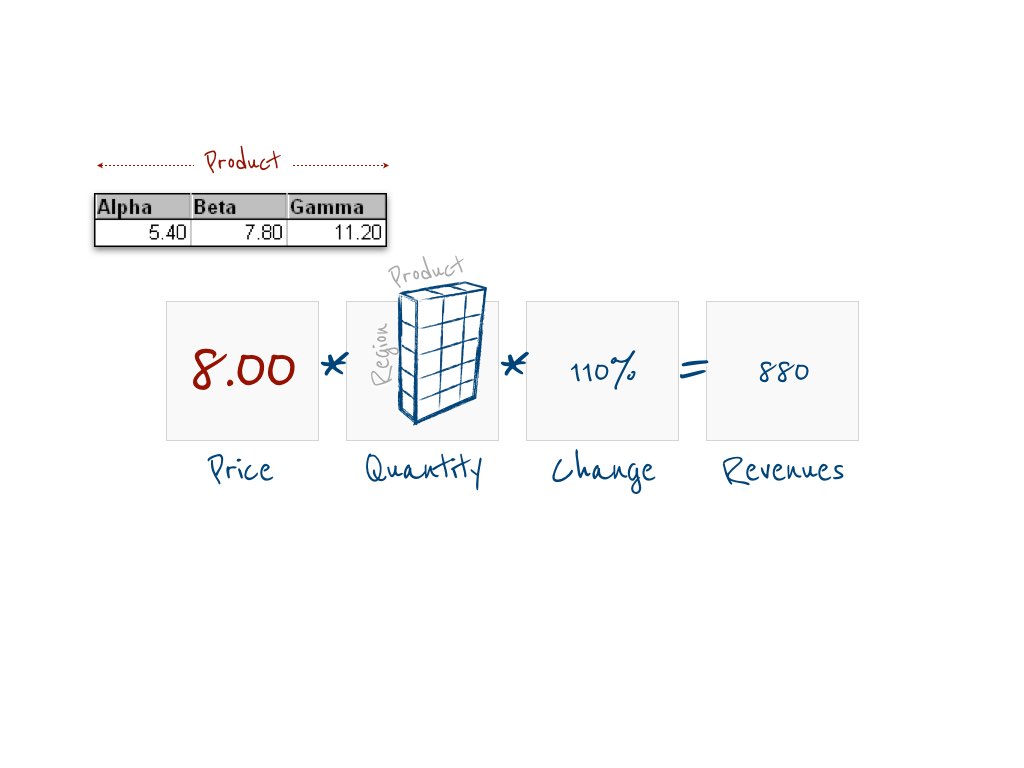
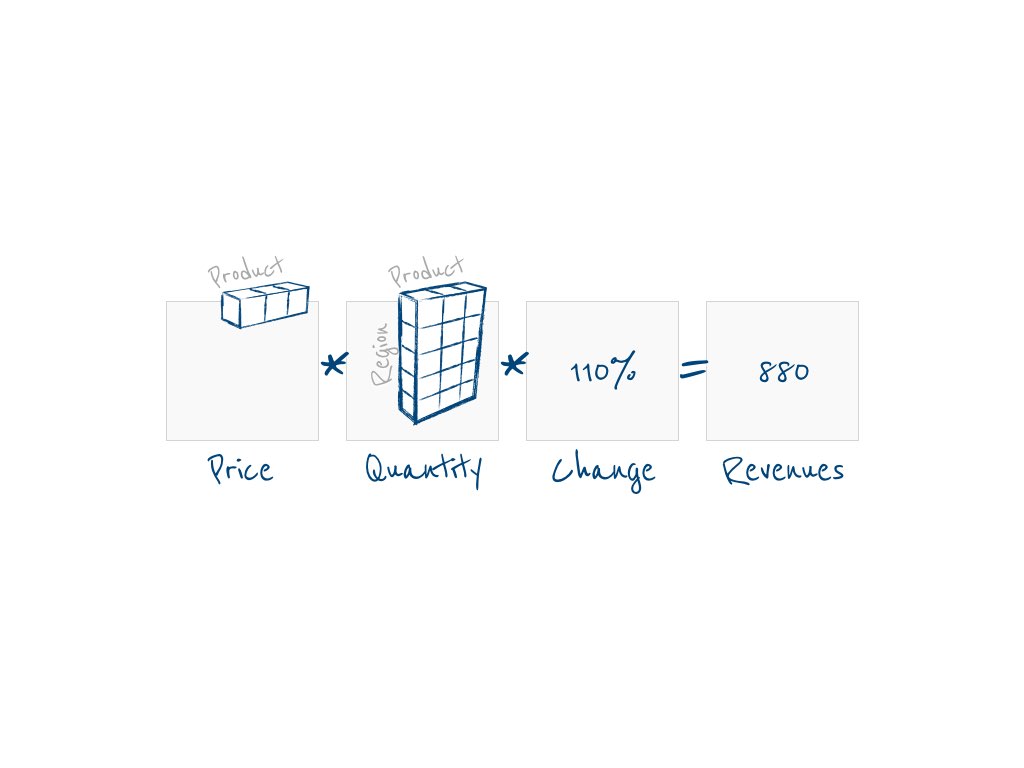
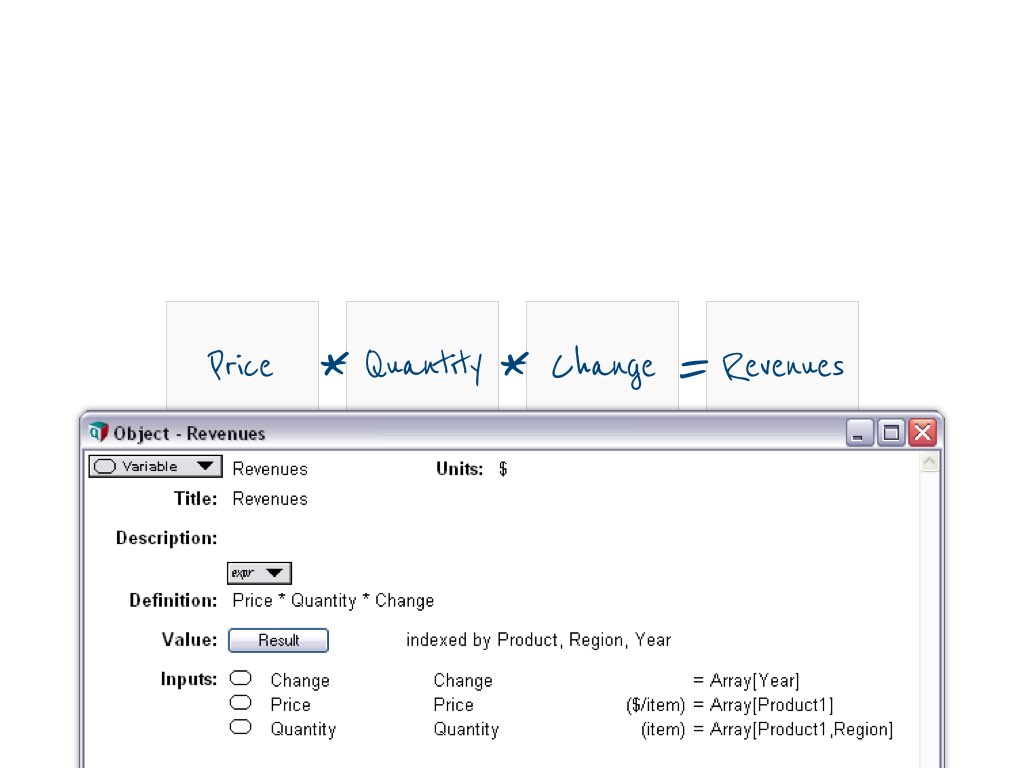
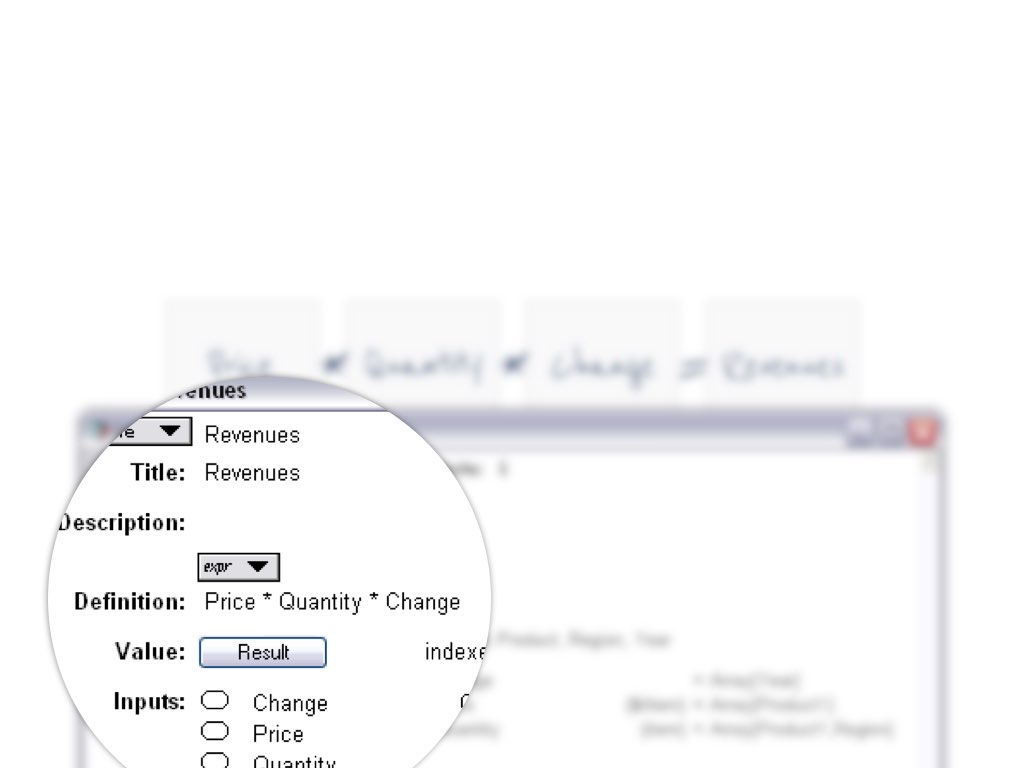
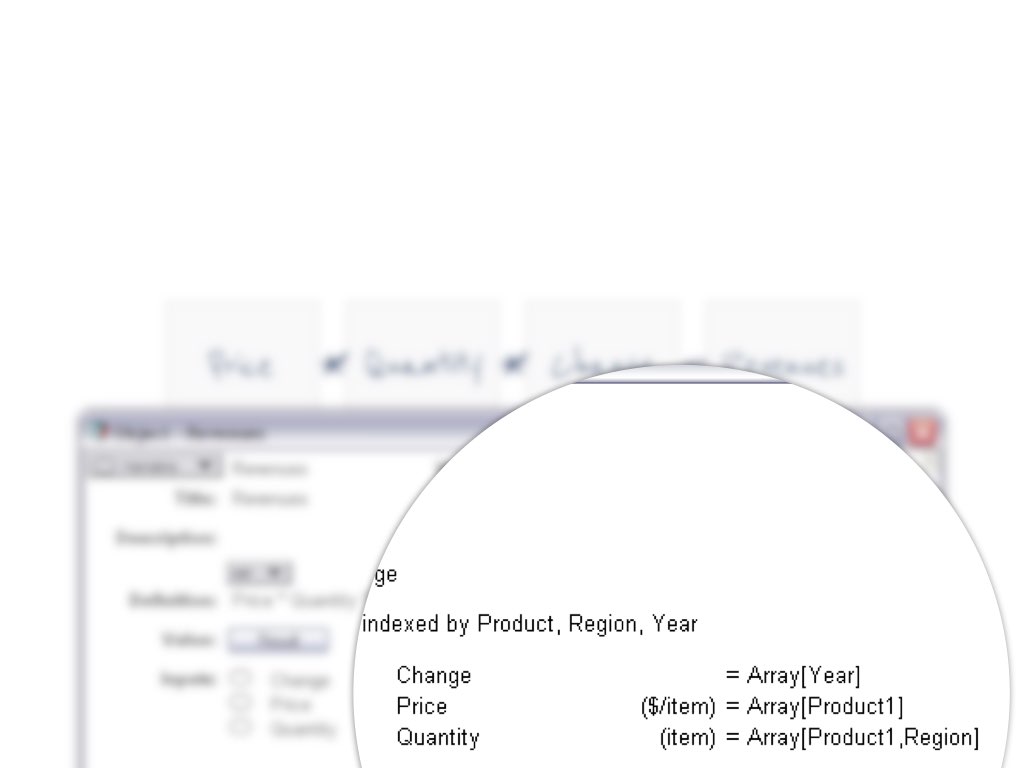
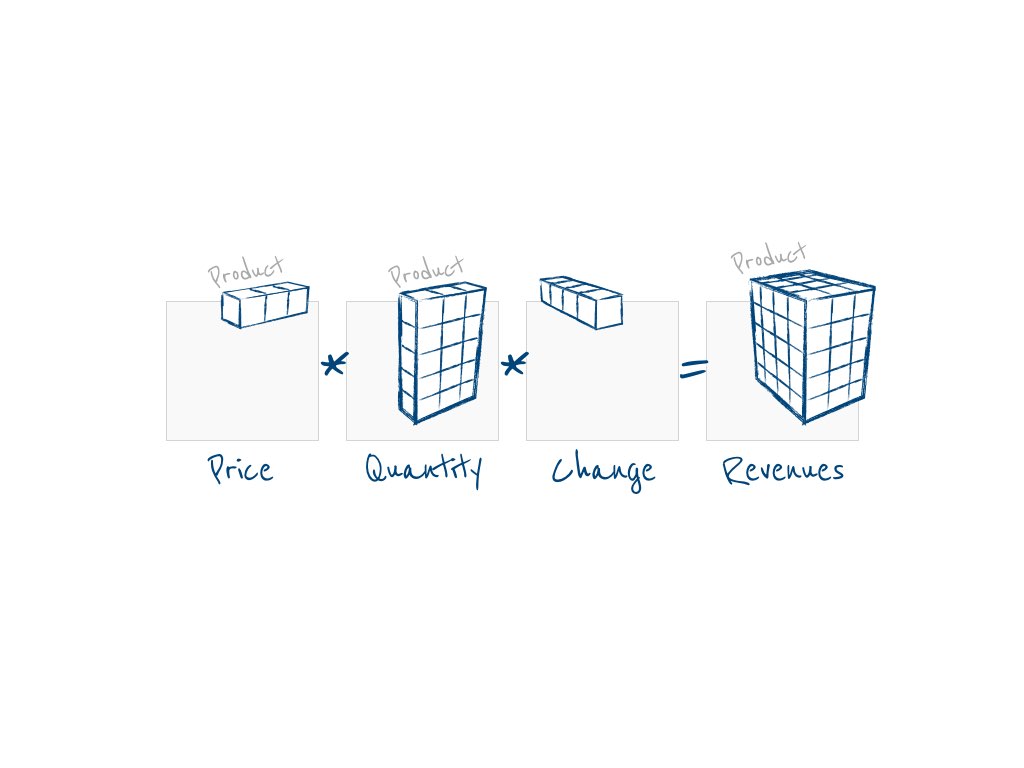
Forget about the rows-and-column restriction of Excel. Analytica’s proprietary Intelligent Arrays™ provide the power to scale up your models to handle multidimensional problems with ease—for instance, sales over many time periods, products, and regions, as a function of alternative prices and marketing budgets. Each dimension becomes a simple index.
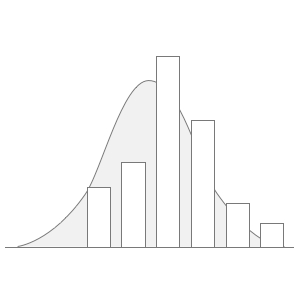
You can easily replace any variable in your model by a probability distribution. Analytica generates sample values based on this and let you see and analyze the effects on every “downstream” variable in the model. With no special statistical expertise required.
Risk and uncertainty are facts of life, which are more easily managed with Analytica. Understand and manage uncertainty explicitly, using probabilities—without requiring special statistical expertise: